
Campus evaluation of the food store environment Focus on quality and availability of fruit and vegetables
According to the National Center for Education Statistics, 66% of the 30.4 million young adults in the United States between 18 and 24 years old are enrolled in postsecondary education1. College students’ poor dietary habits and increasing body weight2,3 increase their risk for obesity4 and other chronic diseases5 later in life. The food environment may play a critical role in shaping dietary habits and weight status6.
Food environments have been described and evaluated, and different food store environment measures have been used to identify the accessibility, availability, affordability, and quality of healthy food in these environments. The food store environment for postsecondary campuses has yet to be described.
Fifteen postsecondary campuses participated and 81 stores evaluated
The aim of our study was to evaluate the food stores on and near 13 universities and two technical colleges in the United States between 2009 and 2011 (53% Northeast, 33.3% Midwest, 13.3% Southeast).
Each campus team used a 1.5-mile radius beyond the campus boundary from which they selected the food stores most frequented by students. The Nutrition Environment Measures Survey for Stores (NEMS-S) developed by Glanz and collaborators7 was modifi ed to evaluate food stores*. Analysis of variance with post hoc Tukey B and t-tests assessed differences between store types and by institutional size.
The study evaluated 81 stores including campus, convenience/drug and grocery stores (respectively 17%, 39% and 44%).
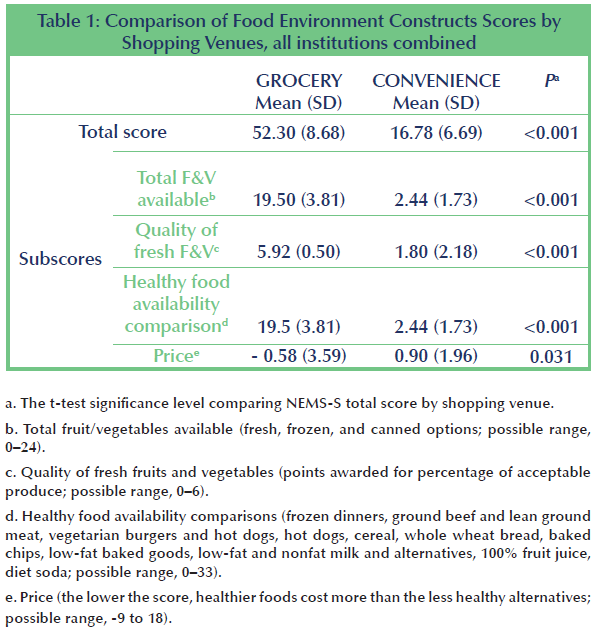
Healthy foods, quality and availability of F&V: higher scores for grocery stores
As there were no significant differences between off-campus convenience/drug and on-campus stores’ total scores and subscores; they were combined into one category (convenience stores). In general (Table 1), grocery stores had signifi cantly higher scores than convenience stores for healthy foods:
- Three times higher than convenience stores on the total food store environment score, and for healthy food availability and quality of fruits and vegetables (F&V);
- Six times higher on total fruits/vegetables available.
However, grocery stores scored significantly lower than convenience stores on the mean price sub-scores, indicating healthier foods cost more than the less healthy alternatives in grocery stores (not in convenience stores).
There were no differences by institutional size for grocery stores. However, smaller institutions’ convenience stores had signifi cantly lower availability and quality of fruits/vegetables and total food store environment scores. For convenience stores, 90.9% of large institutions had fresh fruits, whereas signifi cantly fewer small and medium institutions had any (respectively 50% and 66.6%). Only 10%, 20% and 45.4% of the small, medium and large institution, respectively, sold any fresh vegetables at their convenience stores.
Improve the quality of campus food store environments by supporting environmental and policy initiatives
A college campus provides a food environment with an array of shopping venues, most of which are not consistent with dietary recommendations for obesity prevention. The limited quality of healthy food in on-campus and convenience stores and the exacerbated deficiencies for small postsecondary institutions provide evidence to support environmental and policy initiatives to improve the quality of campus food store environments.
Based on: Horacek TM, Erdman MB, Reznar MM, Olfert M, Brown-Esters ON, Kattelmann KK, Kidd T, Koenings M, Phillips B, Quick V, Shelnutt KP, White AA. Evaluation of the food store environment on and near the campus of 15 postsecondary institutions. Am J Health Promot. 2013 Mar-Apr;27(4):e81-90.
* Each store earned a ‘‘food store environment’’ score similar to a NEMS-S score, between zero and 81 points, comprising four subscores (healthy foods available comparison, total fruits/vegetables available, quality of fresh fruits/vegetables, and price). Subscore points for the healthy foods available comparison category were accumulated for the presence of healthful alternatives, and additional points were earned for the number of varieties of healthful alternatives. The total fruits/vegetables available subscore included fresh, frozen, and canned options. The quality of fresh fruits/ vegetables subscore ranked the percentage of acceptable fruits/vegetables. The price subscore was negative if a healthy alternative was more expensive than the standard item, and positive if it was less expensive.
References
- National Center for Education Statistics.Fast facts. Available at: http://nces.ed. gov/fastfacts/display.asp?id¼98. Accessed November 9, 2011.
- Racette SB, Deusinger SS, Strube MJ, et al. Changes in weight and health behaviors from freshman through senior year of college. J Nutr Educ Behav. 2008;40:39–42.
- Morrell JS, Lofgren IE, Burke JD, Reilly RA. Metabolic syndrome, obesity and related factors among college men andwomen. J Am Coll Health. 2012;60:82–89.
- Kindblom JM, Lorentzon M, Hellqvist A, et al. BMI changes during childhood and adolescence as predictors of amount of adult subcutaneous and visceral adipose tissue in men: the GOOD Study. Diabetes. 2009;58:867–874.
- Mokdad AH, Marks JS, Stroup DF, Gerberding JL. Actual causes of death in the United States, 2000. JAMA. 2004;291:1238–1245.
- Giskes K, van Lenthe F, Avendano-Pabon M, Brug J. A systematic review of environmental factors and obesogenic dietary intakes among adults: are we getting closer to understanding obesogenic environments? Obes Rev. 2011;12:e95–e106.
- Glanz K, Sallis JF, Saelens BE, Frank LD. Nutrition Environment Measures Survey in stores (NEMS-S): development and evaluation. Am J Prev Med. 2007;32:282– 289.