Discriminating nutritional quality of foods using the 5-Color Nutrition Label in the French food market
A recent French proposal for a front-of-pack nutrition labelling system
Recent propositions in public health nutrition in France have put forward the use of a front-of-pack nutrition label on foodstuffs, as a complementary public health tool, in order to help consumers at the point of purchase. This label would summarize the nutritional quality of the food or beverage1, based on the Food Standards Agency nutrient profiling system (FSA score)2-4. The proposed format for the label would include five color-coded categories of nutritional quality (the 5-CNL), and presented in the form of a chain of five discs of the different colors (Green/yellow/orange/pink/red), with a larger disc representing the nutritional quality of the product (see Figure 1).

How to transfer a nutrient profiling system to labelling purposes in the French context ?
However, some adjustments or modifications of the original score may be necessary for it to be consistent so that such a system is adapted for labelling and complies with the French nutritional recommendations5. Finally, in order to be efficient in a purchasing situation, the 5-CNL would need to be able to discriminate the nutritional quality of foods across food groups (e.g. fruit and vegetables should be classified with a higher nutritional quality than snacking products) and within a category (e.g. among dairy desserts, yogurt should be classified with a higher nutritional quality than chocolate pudding).
Objectives: consistency of the classification with French recommendations
Our objectives were to assess the performance of the 5-Colour nutrition label (5-CNL) front-of-pack nutrition label based on the Food Standards Agency nutrient profiling system to discriminate nutritional quality of foods currently on the market in France and its consistency with French nutritional recommendations.
Methods:
Nutritional composition of N=7777 foods available on the French market collected from the web-based collaborative project Open Food Facts were retrieved. FSA score for each food was computed using its composition for 100g in energy, sugars, saturated fatty acids, sodium, proteins, fibers and percentage of fruit and vegetables. Distribution of products across the 5-CNL categories according to food groups, as arranged in supermarket shelves was assessed. Discriminating performance was considered as the number of color categories present in each food group. In the case of discrepancies between the category allocation and French nutritional recommendations, adaptations of the original score were proposed.
Results: Consistency with French recommendations
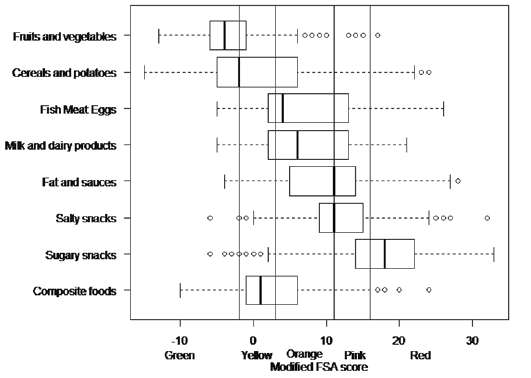
Overall, the distribution of foodstuffs in the 5-CNL categories was consistent with French recommendations: 95.4% of ‘Fruits and vegetables’, 72.5% of ‘Cereals and potatoes’ were classified as ‘Green’ or ‘Yellow’ whereas 86.0% of ‘Sugary snacks’ were classified as ‘Pink’ or ‘Red’. Moreover, within each group, differences in nutritional quality within the various sub-groups were also grasped by the 5-CNL classification, with good discriminating performance (at least 3 colors present) (Figure 2). For example, within ‘Dairy products and fresh desserts’, ‘Milk and yogurt’ were consistently distributed in higher nutritional quality categories than ‘Dairy desserts and other fresh desserts’ (Figure 2). In the ‘Fruit and vegetables’ category, Vegetables were mainly in the ‘Green’ class (87.7%), with some in the ‘Yellow’ class (10.6%) and up to the ‘Pink’ class (0.3%). Fruits were also mainly in the ‘Green’ class (94.5%) or ‘Yellow’ class (3.8%) and up to the ‘Orange’ category (1.6%). Dried fruit, on the other hand, were mainly classified as ‘Orange’ (72.7%) and up to the ‘Rd’ category (3.0%).
Adaptations of the original nutrient profiling system to match recommendations
Adaptations to the original FSA score computation model were necessary for beverages, added fats and cheese in order to be consistent with French official nutritional recommendations. For beverages, the FSA score energy and sugar components of the score were modified taking into account the distribution of energy and sugars in beverages. This allowed for a better discrimination of beverages according to their nutritional quality.
For cheese, the protein component of the score was included in the computation whatever the level of points for unfavourable nutrients (energy, saturates, sugars and sodium), allowing to take into account the calcium content of cheese. For fats, the saturates component of the score was adjusted to take into account the distribution of this component in fats, allowing for a discrimination between animal and vegetable added fats.
Figure 2: Boxplot of the distribution of food groups in the modified FSA score. Lisa Jahns

Conclusion:
The 5-CNL label displays a high performance in discriminating nutritional quality of foods across food groups, within a food group and for similar products from different brands. Adaptations from the original model were necessary to maintain consistency with French recommendations and high performance of the system.
References
1. Hercberg, S. Propositions pour un nouvel élan de la politique nutritionnelle française de santé
publique dans le cadre de la stratégie nationale de santé. 1ère partie : mesures concernant la
prévention nutritionnelle. 2013. Paris. 28-5-2014.
2. Arambepola C, Scarborough P, Rayner M. Validating a nutrient profile model. Public Health Nutr
2008;11:371-8.
3. Rayner, M., Scarborough, P., Stockley, L., and Boxer, A. Nutrient profiles: development of Final
model. Final Report [online]. 2005. London, FSA. 16-1-2014.
4. Rayner, M., Scarborough, P., and Lobstein, T. The UK Ofcom Nutrient Profiling Model – Defining
‘healthy’ and ‘unhealthy’ food and drinks for TV advertising to children. 2009. London, OfCom.
16-1-2014.
5. Julia C, Kesse-Guyot E, Touvier M, Mejean C, Fezeu L, Hercberg S. Application of the British
Food Standards Agency nutrient profiling system in a French food composition database. The British
journal of nutrition 2014;112:1699-705.
