Food consumption in Belgium compared to the foodbased dietary guidelines
The first Belgian Food Consumption Survey
In order to develop effective policies on nutrition it is important to be aware of current dietary patterns. In 2004, the first Belgian Food Consumption Survey (BFCS) was initiated. An in-depth description of the study design and the methodology used is given elsewhere1, 2.
Information on food intake was collected with two non-consecutive 24 hour recalls, using EPIC-SOFT3. Habitual food intake was estimated by the Nusser method4. One of the aims of the BFCS is to monitor the adequacy of food intakes and to determine the proportion of the population meeting the food-based dietary guidelines (FBDG).
The food-based dietary guidelines (FBDG)
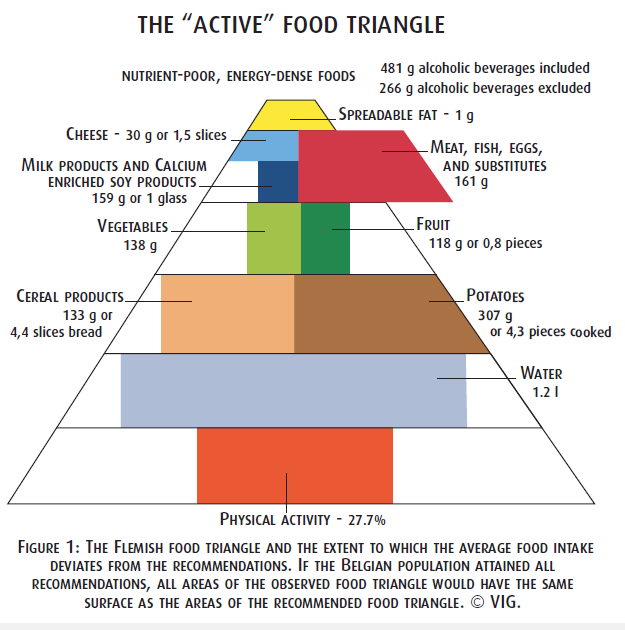
FBDG were developed and used internationally to express the principles of a balanced diet in terms of foods. In Belgium, a food triangle and a food pyramid were developed by the regional health authorities responsible for health promotion. Although both guidelines are similar, food intakes were compared with the Flemish recommendations, since the latter describe the guidelines in terms of both the number of pieces and the amount. According to the food triangle a healthy diet is based on balance, variation and moderation. The triangle is composed of eight food groups: water; grains and potatoes; vegetables; fruits; dairy (including cheese) and Ca-enriched soy products; meat, fish, eggs, legumes, nuts and meat substitutes; fats; and energy-dense, nutrient-poor foods. The water group includes water, coffee, tea and broth. The bigger the surface of a particular food group in the triangle, the bigger the daily consumption of that food group should be relative to the other food groups. To allow the comparison of food intake with the FBDG, the portion size of some reported foods had to be converted into an equivalent of another food using conversion factors proposed in the food guides.
The gap between recommendations and consumption
Results show that the overall food intake of the Belgian population did not comply with the FBDG (Figure 1). The base of the food triangle describes the recommendation for physical activity. The majority of the population was classified as inactive (41.1%). Only 27.7% of the population was physically active enough to experience health-enhancing effects.
The mean daily intake of beverages (water, coffee, tea and broth) was 1202 ml (SD 593). The recommendation for water intake was met by only 26.2% of the population.
The mean daily intake of vegetables was 138g (SD 53). This is inadequate and far below the recommended intake of at least 350g/d. Only 1 in 1,000 persons met this recommendation. Even when vegetable soups and juices were included, only 13.0% of women and 8.8% of men complied with this recommendation.
The mean daily intake of fruits was hardly 118g (SD 84) while the lower limit of the recommendation is 250g/d. Only 7.6% of the population met this recommendation. Adolescents are recommended to consume at least 375g fruit daily. None of them met this recommendation. When fruit juices were included, only 21.6% of the general population met the recommendation.
The mean daily intake of dairy and soy products was 159 g (SD 127). The average daily intake of cheese was 30g (SD 18), which is higher than the lower limit of the recommendation (20g/d). Only 3.4% of the population met the recommendation of consuming at least 450 g dairy or Caenriched soy products daily, while 68.1% of them consumed at least 20g cheese daily. A quarter of them exceeded the recommendation by eating more than 40g/d.
The mean intake of meat, fish, eggs and meat substitutes exceeded the upper limit of the recommendation by 1.6 times. Only 11.9% of the population consumed less than 100g of these products daily. The mean daily intake of fish and crustaceans was 24 (SD 14) g, which was below the recommended intake of 30g/d; nearly 70% of the population did not meet this recommendation.
Less than 10% eat the recommended F&V portion
The mean daily intake of nutrient-poor, energy-dense foods was 481g (SD 395) (alcohol included). The majority of the population (92.0%) consumed more than 100g of these products daily.
The consumption of food products from the triangle tip and the meat group is excessive, while the average daily portions consumed from all other groups, except for cheese, potatoes, rice and pasta, are below the recommendations. For vegetables, fruits, dairy products and energydense, nutrient-poor foods, the percentage of the population meeting the recommendations is below 10%.

References
- De Vriese S, Debacker G, de Henauw S, Huybrechts I, Kornitzer M, Leveque A et al. The Belgian food consumption survey: aims, design and methods. Arch Public Health 2005; 63:1-16.
- Vandevijvere S, De Vriese S, Huybrechts I, Moreau M, Temme E, de Henauw S et al. The gap between food-based dietary guidelines and usual food consumption in Belgium, 2004. Public Health Nutr 2009; 12(3):423-431.
- Slimani N, Valsta L. Perspectives of using the EPIC-SOFT programme in the context of pan- European nutritional monitoring surveys: methodological and practical implications. Eur J Clin Nutr 2002; 56 Suppl 2:S63-S74.
- Nusser SM, Carriquiry AL, Dodd KW, Fuller WA. A semiparametric transformation approach to estimating usual daily intake distributions. J Am Stat Assoc 1996; 91:1440-1449.
- Vlaams Instituut voor Gezondheidspromotie. De voedingsdriehoek: een praktische voedingsgids. 2004. Brussels.
