Fruits and vegetables as a marker for dietary alkali intake
Why care about whether or not your diet is net acid or base forming?
Present day diets in industrialized countries tend to be net acid forming, due to the high intake of grains and animal food products and the relatively low intake of fruits and vegetables. As we get older, the kidney’s ability to excrete excess acid declines. This combination of high dietary acid intake and reduced renal acid excretion tends to lead to higher net acid balances as we age. This leads to a “trade-off”, where to maintain electrical neutrality and buffer the excess acid, the body has to use endogenous buffers such as bone alkali, and may have to accept a slightly higher acid balance, such as a slightly lower blood pH. This in turn may be a factor in diseases of “old age“, such as osteoporosis and agerelated muscle wasting .
Estimating dietary net endogenous acid production (NEAP)
Since determining renal acid excretion requires a special research laboratory to measure the various components, much interest has focused on developing methods of estimating the body’s acid-base balance from dietary intake. These dietary acid loads can be estimated as the net endogenous acid production (NEAP) by various methods, but they all either estimate or measure the dietary components shown to be responsible for acid production: [sulfate (SO4), phosphate (PO4), and fixed organic acids such as hippuric acid; and those responsible for alkali production – potassium (K) salt of organic anions or “unmeasured anions“ (UA), where K has been used as an estimate of dietary base intake.
Acid-producing and base-producing foods
We used the U.S. Department of Agriculture nutrient database to calculate the net acid or base load for individual foods (ref 6). Since each food has a different composition, the various NEAP components can be assessed for each of them. We took 51 items from the USDA database which included 19 vegetables, 10 nut foods and 22 fruits (FV), and compared this to 24 items from the same database including 5 grains, 7 dairy products, 1 egg and 11 meat items (AP).
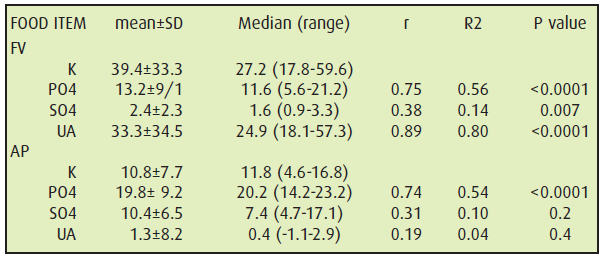
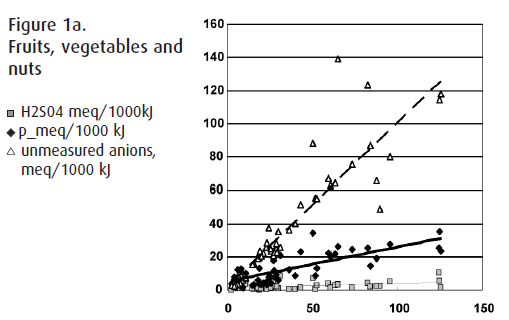
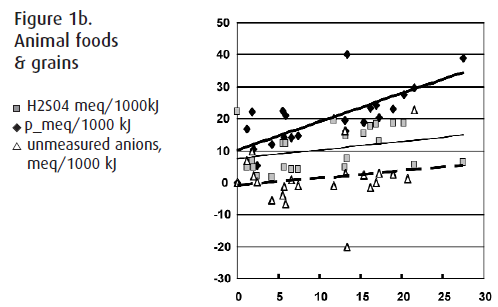
The following table demonstrates the mean and median values for potassium intake and the univariate correlations of dietary potassium with phosphate, sulphate, and the unmeasured anions in FV and AP foods. Figures 1a and 1b visually demonstrate these univariate correlations. All numbers are in milliequivalents (meq) per 1000kJ.

Both the median and range of K content was much greater in the FV foods compared to the AP (p< 0.0001). Figure 1a demonstrates that as the K content of FV increases, the UA increase to a greater extent than the PO4 or SO4. By best subset analysis, UAs explained 83% of the variability in K intake (R2=0.83, p<0.0001), and PO4 (R2=0.84, p=0.03) and SO4 (R2=0.85, p=0.10) explained about an additional 1% each.

Conversely, in animal foods (Fig 1b), the PO4 content was significantly higher than in the FV (p=0.006), the SO4 content was significantly higher than in the FV (p<0.0001) and the UA content was significantly lower in the AP group than the FV (p<0.001). By best subset analysis, PO4 content explained 44% of the variability in K intake (R2 =0.44, p=0.002), and SO4 (R2=0.56, p=0.01) and UAs (R2=0.66, p=0.03) explained another 12% each.

So, in as much as the K content correlates to the PO4 and SO4 content of foods, using only dietary K intake will tend to overestimate alkali intake. This is partially mediated by the average K content of animal foods, which tends to be significantly lower than in vegetable foods and therefore would contribute less to the total dietary K. However, as we have shown, in general fruits and vegetables are higher in alkali, and increased ingestion should help balance the high acid loads found in the diets most prevalent in industrialized countries which are made up of animal foods and grains. Whether or not eating a net base-producing diet will also improve some of the age-related, acidosis-related conditions mentioned previously, such as osteoporosis and muscle wasting, remains to be proven.
References
- Frassetto LA et al. Am J Physiol. 1996;271(6 Pt 2):F1114-22.
- Alpern R. Kidney Int. 1995; 47(4):1205-15.
- New SA et al. Am J Clin Nutr 2000;71:142-51..
- Alexy U et al. Am J Clin Nutr 2005;82:1107-14.
- Remer T et al. Am Diet Assoc. 1995; 95(7):791-7.
- Sebastian A et al. Am J Clin Nutr 2002;76:1308-16.
- Kleinmann JG, Lemann JJ. Acid production. In: Maxwell MH, Kleeman CR, Narins
- RG, eds. Clinical Disorders Of Fluid And Electrolyte Metabolism. New York: McGraw-
Hill; 1987 p.159 73. - Frassetto L et al. Am J Clin Nutr 1998; 68(3):576-83.
http://www.nal.usda.gov/fnic/foodcomp/search/
