Trends in obesity prevalence among WIC-enrolled children: Differences by socioeconomic characteristics
In the United States, an inverse relationship between socioeconomic status (SES) and childhood obesity exists1. The trends in obesity prevalence by SES among WIC-participating children are rarely studied because only low-income children can participate in WIC. However, recent efforts have begun to examine obesity trends among these children by SES2 since this information can inform policy and program development for this population.
This study examined whether secular trends in early childhood obesity varied according to SES among WIC-enrolled preschool-aged children in Los Angeles County (LAC) from 2003 to 2014.
We used administrative data containing sociodemographic and anthropometric information on 2-4-year-olds participating in WIC in LAC from 2003 to 2014. Children’s heights and weights were measured during clinic visits by trained WIC staff. Obesity status was defined as having a BMI ≥ 95th percentile of CDC’s gender- and age-specific growth reference values3. SES was operationalized as :
- household income, a percentage of the federal poverty level (FPL), and
- household education, the highest grade completed by the child’s caregiver.
Within each age group, the trends in obesity prevalence were examined by SES. The sample included 739,893 2-year-olds, 708,349 3-year-olds, and 568,816 4-year-olds. Statistically significant differences between trends were assessed and average annual percent changes in obesity prevalence over the entire 12-year time period were examined.
Trends in obesity by child’s age
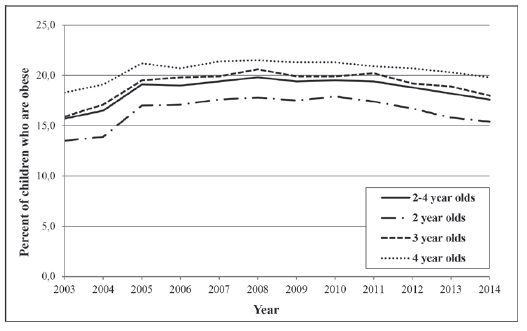
The overall secular trend in obesity prevalence in our study significantly increased from 15.7% in 2003 to 19.1% in 2005, remained relatively constant until 2010, then decreased to17.6% in 2014 (Figure 1).
Two and 3-year-olds experienced the greatest overall increase in obesity prevalence from 2003 to 2014.

Figure 1. Trends in obesity prevalence among WIC participating children by age: Los Angeles County, 2003- 2014
Trends in obesity by household income
At every year and across all three age groups, obesity prevalence tended to be higher among children living in the lowest income households.
Despite decreasing since 2010, obesity prevalence in 2014 was higher than in 2003 for all children but the least poor. It decreased to 2003 levels for 3- and 4-year-olds from households at >133% FPL and > 100% FPL, respectively. The prevalence of obesity worsened among 3- and 4-year-olds from poor households (<100%FPL) but not from low-income households (>100% FPL).
Trends in obesity by household education
A pronounced and consistent gradient in obesity by household education existed at every year and across all three age groups with children in the lowest educated households experiencing the highest rates of obesity.
Similar to household income, obesity prevalence in 2014 was higher than in 2003 for most children although it decreased to 2003 levels for 2- and 4-year-olds from college-educated households. Overall obesity did not change for the higher-educated households during the study’s 12 years. However, it worsened among the lower-educated households (i.e., households without a college degree among 2-year-olds, and households with a high-school degree or less among 3- and 4-year-olds).
Next steps…
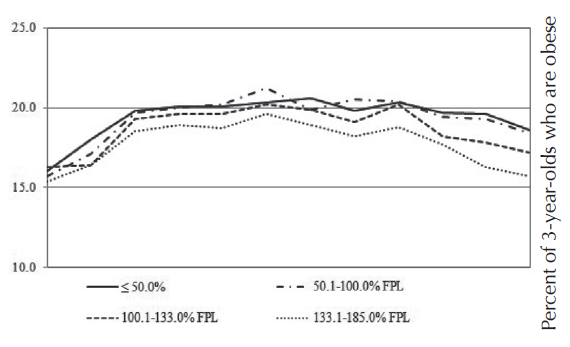
The decreasing trend between 2010 and 2014 is encouraging and mirrors national trends among WIC-participating children4. However, differences exist by child’s SES. Children from less educated and poorer households experienced significant overall increases in obesity prevalence from 2003 to 2014 while children from more educated and less poor households generally did not experience a significant change (Figure 2). These socioeconomic differences may be partially due to the capacity of these less poor and more educated households to more readily take advantage of obesity-prevention efforts.

Figure 2. Trends in obesity by household income among WICparticipating 3-year-olds: Los Angeles County, 2003-14
In the fight against childhood obesity, low-income families’ socioeconomic circumstances should be targeted, as they are at increased risk of obesity and may not be reaping the greatest benefit from obesity-prevention efforts. Every effort should be made to target obesity risk factors during a child’s first two years as by age 2 socioeconomic disparities in obesity already exist. Additional studies should explore the role of SES on early childhood obesity among low-income children and the most effective interventions for these vulnerable children.
Based on: Nobari TZ, Whaley SE, Prelip M, Crespi CM, Wang MC. (2018) Trends in obesity by socioeconomic status among WIC children in Los Angeles County, 2003-2014.
Childhood Obesity 2018; 14(4):248-258. Permission was given by the publisher, Mary Ann Liebert, Inc., New Rochelle, NY, for this summary and use of the images.
References
- Ogden CL, Carroll MD, Fakhouri TH, et al. Prevalence of obesity among youths by household income and education level of head of household – United States 2011-
2014. MMWR Morb Mortal Wkly Rep 2018;67(6):186-189. - Freedman DS, Sharma AJ, Hamner HC, et al. Trends in weight-for-length among infants in WIC from 2000 to 2014. Pediatrics 2017;139(1).
- Kuczmarski RJ, Ogden CL, Guo SS, et al. 2000 CDC Growth Charts for the United States: methods and development. Vital Health Stat 11 2002;(246):1-190.
- Pan L, Freedman DS, Sharma AJ, et al. Trends in obesity among participants aged 2–4 years in the Special Supplemental Nutrition Program for Women, Infants, and Children — United States, 2000–2014. MMWR Morb Mortal Wkly Rep 2016;65(45):1256-1260
