Pea

Description
- Peas (Pisum sativum) belong to the Fabaceae family.
- There are different cultivars of peas including ‘Orb’, ‘CDC Stricker’ (Ubayasena, 2010), ‘Maxigolt’ (Sell, 2005), ‘Avola’, ‘Tristar’, ‘Rampart’, ‘Turon, Bella’ and ‘Greenshaft’ (Edelenbos, 2001).
PHYSICAL AND ORGANOLEPTIC CHARACTERISTICS
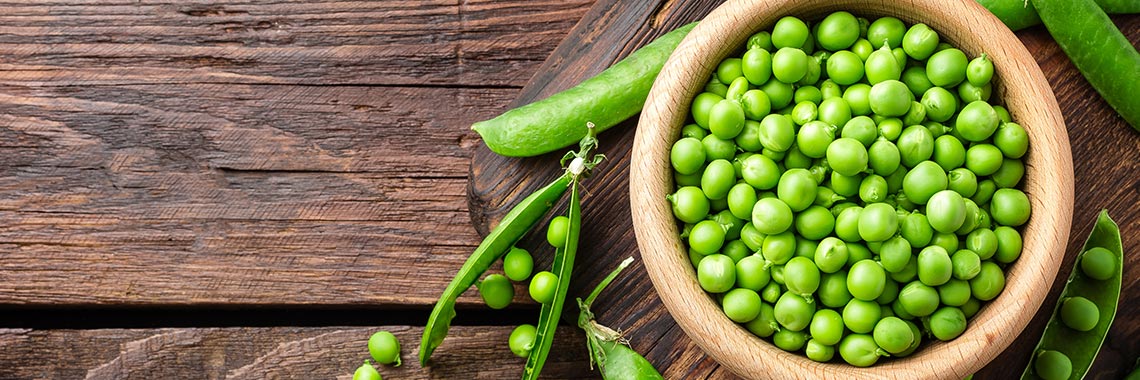
- The colour and shape of the pea are the main quality criteria (Ubayasena, 2011).
- The best known and most common peas are green (Pisum sativum ‘Orb’ x Pisum sativum ‘CDC Striker’), but there are also yellow peas (Pisum sativum ‘Alfetta’ x Pisum sativum ‘CDC Bronco’) (Ubayasena, 2011).
- The colour, surface and shape of peas vary depending on the cultivar. The colours range from dark green to yellow, brown, orange and light green. The surface can be smooth or rough and the shape elliptical, cylindrical, rhomboid or irregular (Santos, 2019).
- Irregularly shaped peas have higher protein and starch content and require longer cooking times. Dark green peas tend to have a higher protein content than yellow ones, and light green ones show a higher resistant starch content than brown ones (Santos, 2019).
- Peas with a smooth surface require a shorter cooking time, but have a lower protein content than those with a rough surface (Santos, 2019).
- The green colour of the pea is due to the presence of chlorophyll. When the green pea is stored in the light, the chlorophyll degrades and the pea turns white (McDonald, 2019).
- A study conducted on six pea cultivars revealed the presence of seventeen pigments, including chlorophyll derivatives and carotenoids. Their concentrations vary according to the cultivars and the degree of ripening (Edebenlos, 2001).
- Ten odorous compounds (5 aldehydes, 4 alcohols and 1 acid) were identified in raw peas. Among these compounds, 3-methylbutanoic acid (herb note) and hexanal (almond note) presented the strongest aromatic indices.
- The aroma also depends on the cultivar and storage conditions (Bi, 2020).
RAW
The following values are approximate and depend on variety, season, ripeness, cultivation conditions, etc. Raw peas provide an average of 66.90 calories (kcal) per 100 g, i.e. 281 kJ.
COMPOSITION TABLES
For each nutrient, the tables provide information on the content, minimum and maximum values, as well as the percentage of the Dietary Reference Values (DRVs) for 100 g net of raw peas.
MACRONUTRIENTS
| Constituent (g) | Average content |
Min-Max per 100g |
DRV% |
|---|---|---|---|
| Water | 79,20 | 75,80 - 83,20 | - |
| Fibers | 5,50 | 4,70 - 6,70 | - |
| Carbohydrates | 7 | - | 2,69 |
| Sugars | 5,67 | - | 6,30 |
| Lipids | 0,55 | 0,40 - 0,80 | 0,79 |
| Saturated fat | 0,10 | 0,071 - 0,13 | 0,50 |
| Protein | 5,84 | 4,70 - 7 | 11,68 |
| Constituent (g) | Amount | Min-Max | DRV% |
|---|---|---|---|
| Water | Ciqual 2020 | - | - |
| Fibers | Ciqual 2020 | - | - |
| Carbohydrates | Ciqual 2020 | - | Règlement (UE) N°1169/2011 du parlement Européen, et du conseil du 25 octobre 2011 |
| Sugars | Ciqual 2020 | - | Règlement (UE) N°1169/2011 du parlement Européen, et du conseil du 25 octobre 2011 |
| Lipids | Ciqual 2020 | - | Règlement (UE) N°1169/2011 du parlement Européen, et du conseil du 25 octobre 2011 |
| Saturated fat | Ciqual 2020 | - | Règlement (UE) N°1169/2011 du parlement Européen, et du conseil du 25 octobre 2011 |
| Protein | Ciqual 2020 | - | Règlement (UE) N°1169/2011 du parlement Européen, et du conseil du 25 octobre 2011 |
Zoom on carbohydrates
- The energy of raw peas comes mainly from its carbohydrates, at 7 g per 100 g.
- This amount is significantly higher than the average quantity of carbohydrates in raw vegetables (4.45 g per 100 g).
Zoom on fibres
- Raw peas are a source of fibre*, providing more than 3 g of fibre per 100 g, i.e. 5.50 g per 100 g.
- This amount is higher than the average quantity of fibre in raw vegetables (2.43 g per 100 g).
Zoom on proteins
- Its protein content (5.83 g per 100 g) is much higher than the average amount found in raw vegetables (1.87 g per 100 g).
Zoom on lipids
- The fat content of raw peas (0.55 g per 100 g) is almost identical to the average amount found in raw vegetables (0.56 g per 100 g).
- Raw peas are low in fat* as they contain no more than 3 g per 100 g.
*Regulation (EC) No 1924/2006 of the European Parliament and of the Council of 20 December 2006 on nutrition and health claims made on foods.
MINERALS AND TRACE ELEMENTS
| Constituent | Average content |
Min-Max per 100g |
DRV% |
|---|---|---|---|
| Calcium (mg) | 27,50 | 24 - 33 | 3,44 |
| Chloride (mg) | 37,50 | 36 - 39 | 4,69 |
| Copper (mg) | 0,14 | 0,015 - 0,19 | 14 |
| Iron (mg) | 1,64 | 1,20 - 2,60 | 11,71 |
| Iodine (µg) | 0,15 | NC - 0,55 | 0,10 |
| Magnesium (mg) | 30,50 | 25,80 - 33,50 | 8,13 |
| Manganese (mg) | 0,40 | 0,34 - 0,43 | 20 |
| Phosphorus (mg) | 119 | 108 - 150 | 17 |
| Potassium (mg) | 272 | 244 - 320 | 13,60 |
| Selenium (µg) | 1,02 | NC - 2,50 | 1,85 |
| Sodium (mg) | 3,50 | 1,50 - 5 | - |
| Zinc (mg) | 1 | 0,40 - 1,40 | 10 |
| Constituent | Amount | Min-Max | DRV% |
|---|---|---|---|
| Calcium (mg) | Ciqual 2020 | - | Règlement (UE) N°1169/2011 du parlement Européen, et du conseil du 25 octobre 2011 |
| Chloride (mg) | Ciqual 2020 | - | Règlement (UE) N°1169/2011 du parlement Européen, et du conseil du 25 octobre 2011 |
| Copper (mg) | Ciqual 2020 | - | Règlement (UE) N°1169/2011 du parlement Européen, et du conseil du 25 octobre 2011 |
| Iron (mg) | Ciqual 2020 | - | Règlement (UE) N°1169/2011 du parlement Européen, et du conseil du 25 octobre 2011 |
| Iodine (µg) | Ciqual 2020 | - | Règlement (UE) N°1169/2011 du parlement Européen, et du conseil du 25 octobre 2011 |
| Magnesium (mg) | Ciqual 2020 | - | Règlement (UE) N°1169/2011 du parlement Européen, et du conseil du 25 octobre 2011 |
| Manganese (mg) | Ciqual 2020 | - | Règlement (UE) N°1169/2011 du parlement Européen, et du conseil du 25 octobre 2011 |
| Phosphorus (mg) | Ciqual 2020 | - | Règlement (UE) N°1169/2011 du parlement Européen, et du conseil du 25 octobre 2011 |
| Potassium (mg) | Ciqual 2020 | - | Règlement (UE) N°1169/2011 du parlement Européen, et du conseil du 25 octobre 2011 |
| Selenium (µg) | Ciqual 2020 | - | Règlement (UE) N°1169/2011 du parlement Européen, et du conseil du 25 octobre 2011 |
| Sodium (mg) | Ciqual 2020 | - | - |
| Zinc (mg) | Ciqual 2020 | - | Règlement (UE) N°1169/2011 du parlement Européen, et du conseil du 25 octobre 2011 |
Zoom on minerals and trace elements
- Raw peas are a source of:
- manganese as they provide the equivalent of 20% of DRVs, i.e. 0.40 mg per 100 g;
- phosphorus as they provide the equivalent of 17% of DRVs, i.e. 119 mg per 100 g.
- They contain significant amounts of copper, potassium, iron and zinc. They provide the equivalent of:
- 14% of DRVs for copper, i.e. 0.14 mg per 100 g;
- 13.60% of DRVs for potassium, i.e. 272 mg per 100 g;
- 11.71% of DRVs for iron, or 1.64 mg per 100 g;
- 10% of DRVs for zinc, i.e. 1 mg per 100 g.
- The other minerals represent less than 9% of DRVs.
VITAMINS
| Constituent | Average content |
Min-Max per 100g |
DRV% |
|---|---|---|---|
| Provitamin A Beta-carotene (µg) | 449 | 340 - 557 | - |
| Vitamin A equivalent (µg) | 74,83 | 56,67 - 92,83 | 9,35 |
| Vitamin B1 (mg) | 0,29 | 0,26 - 0,37 | 26,36 |
| Vitamin B2 (mg) | 0,13 | 0,11 - 0,20 | 9,29 |
| Vitamin B3 (mg) | 2,15 | 1,87 - 2,62 | 13,44 |
| Vitamin B5 (mg) | 0,43 | 0,10 - 0,75 | 7,17 |
| Vitamin B6 (mg) | 0,16 | 0,093 - 0,19 | 11,43 |
| Vitamin B9 (µg) | 45 | 25 - 65 | 22,50 |
| Vitamin C (mg) | 41,50 | 32 - 59 | 51,88 |
| Vitamin E (mg) | 0,075 | 0,02 - 0,13 | 0,63 |
| Vitamin K1 (µg) | 47,40 | 24,80 - 70 | 63,20 |
| Constituent | Amount | Min-Max | DRV% |
|---|---|---|---|
| Provitamin A Beta-carotene (µg) | Ciqual 2020 | - | - |
| Vitamin A equivalent (µg) | Calcul à partir de la valeur Provitamine A Béta-carotène* | - | Règlement (UE) N°1169/2011 du parlement Européen, et du conseil du 25 octobre 2011 |
| Vitamin B1 (mg) | Ciqual 2020 | - | Règlement (UE) N°1169/2011 du parlement Européen, et du conseil du 25 octobre 2011 |
| Vitamin B2 (mg) | Ciqual 2020 | - | Règlement (UE) N°1169/2011 du parlement Européen, et du conseil du 25 octobre 2011 |
| Vitamin B3 (mg) | Ciqual 2020 | - | Règlement (UE) N°1169/2011 du parlement Européen, et du conseil du 25 octobre 2011 |
| Vitamin B5 (mg) | Ciqual 2020 | - | Règlement (UE) N°1169/2011 du parlement Européen, et du conseil du 25 octobre 2011 |
| Vitamin B6 (mg) | Ciqual 2020 | - | Règlement (UE) N°1169/2011 du parlement Européen, et du conseil du 25 octobre 2011 |
| Vitamin B9 (µg) | Ciqual 2020 | - | Règlement (UE) N°1169/2011 du parlement Européen, et du conseil du 25 octobre 2011 |
| Vitamin C (mg) | Ciqual 2020 | - | Règlement (UE) N°1169/2011 du parlement Européen, et du conseil du 25 octobre 2011 |
| Vitamin E (mg) | Ciqual 2020 | - | Règlement (UE) N°1169/2011 du parlement Européen, et du conseil du 25 octobre 2011 |
| Vitamin K1 (µg) | Ciqual 2020 | - | Règlement (UE) N°1169/2011 du parlement Européen, et du conseil du 25 octobre 2011 |
Zoom on vitamins
- Raw peas are high in:
- vitamin K1 as they provide the equivalent of 63.20% of DRVs per 100 g, i.e. 47.40 µg per 100 g;
- vitamin C as they provide the equivalent of 51.88% of DRVs per 100 g, i.e. 41.50 mg per 100 g.
- They are also a source of:
- vitamin B1 as they provide the equivalent of 26.36% of DRVs, i.e. 0.29 mg per 100 g; according to the data of the Ciqual 2020 table, the raw pea is the vegetable which contains the most vitamin B1.
- vitamin B9 as they provide the equivalent of 22.50% of DRVs, i.e. 45 µg per 100 g.
- Raw peas also contain significant amounts of vitamin B3 and vitamin B6. They provide the equivalent of:
- 13.44% of DRVs for vitamin B3, i.e. 2.15 mg per 100 g;
- 11.43% of DRVs for vitamin B6, i.e. 0.16 mg per 100 g.
Moreover, raw peas are the second vegetable, after mushrooms, that contains the most vitamin B3, according to the Ciqual 2020 table.
- The other vitamins are present in smaller quantities, since they cover less than 10% of DRVs.
*Calculation made: Beta Carotene / 6 + retinol
POLYPHENOLS
| Constituent (mg) | Average content |
Min-Max per 100mg |
|---|---|---|
| Flavonoids (mg) | 0,02 | 0,02 - 0,02 |
| of which Flavanols (mg) | 0,02 | 0,02 - 0,02 |
| Total polyphenols | 0,02 | 0,02 - 0,02 |
| Constituent (mg) | Amount | Min-Max |
|---|---|---|
| Flavonoids | Phénol-Explorer version 3.6 Méthode utilisée : Chromatographie | - |
| of which Flavanols | Phénol-Explorer version 3.6 Méthode utilisée : Chromatographie | - |
| Total polyphenols | Phénol-Explorer version 3.6 Méthode utilisée : Chromatographie | - |
Zoom on polyphenols
- Polyphenols are substances with an antioxidant effect.
- Raw peas contain a small amount of polyphenols (0.02 mg per 100 g).
- According to the chromatography method, flavanols, a subgroup of flavonoids, are the only polyphenols found in raw peas.
BOILED
The following values are approximate and depend on variety, season, ripeness, cultivation conditions, etc
Peas boiled in water provide an average of 80.30 calories (kcal) per 100 g, i.e. 338 kJ.
COMPOSITION TABLES
For each nutrient, the tables provide information on the content, minimum and maximum values, as well as the percentage of the Dietary Reference Values (DRVs) per 100 g net of boiled peas.
MACRONUTRIENTS
| Constituent (g) | Average content |
Min-Max per 100g |
DRV% |
|---|---|---|---|
| Water | 77,4 | - | - |
| Fibers | 4,80 | - | - |
| Carbohydrates | 9,93 | - | 3,82 |
| Sugars | 1,60 | - | 1,78 |
| Lipids | 0,60 | - | 0,86 |
| Saturated fat | 0,15 | - | 0,75 |
| Protein | 6,38 | NC - 6,40 | 12,76 |
| Constituent (g) | Amount | Min-Max | DRV% |
|---|---|---|---|
| Water | Ciqual 2020 (valeur issue des analyses Ciqual-Aprifel 2018) | - | - |
| Fibers | Ciqual 2020 (valeur issue des analyses Ciqual-Aprifel 2018) | - | - |
| Carbohydrates | Ciqual 2020 | - | Règlement (UE) N°1169/2011 du parlement Européen, et du conseil du 25 octobre 2011 |
| Sugars | Ciqual 2020 (valeur issue des analyses Ciqual-Aprifel 2018) | - | Règlement (UE) N°1169/2011 du parlement Européen, et du conseil du 25 octobre 2011 |
| Lipids | Ciqual 2020 (valeur issue des analyses Ciqual-Aprifel 2018) | - | Règlement (UE) N°1169/2011 du parlement Européen, et du conseil du 25 octobre 2011 |
| Saturated fat | Ciqual 2020 (valeur issue des analyses Ciqual-Aprifel 2018) | - | Règlement (UE) N°1169/2011 du parlement Européen, et du conseil du 25 octobre 2011 |
| Protein | Ciqual 2020 | - | Règlement (UE) N°1169/2011 du parlement Européen, et du conseil du 25 octobre 2011 |
Zoom on carbohydrates
- The energy of raw peas comes mainly from its carbohydrates, at 7 g per 100 g.
- This amount is significantly higher than the average quantity of carbohydrates in raw vegetables (4.45 g per 100 g).
Zoom on fibres
- Raw peas are a source of fibre*, providing more than 3 g of fibre per 100 g, i.e. 5.50 g per 100 g.
- This amount is higher than the average quantity of fibre in raw vegetables (2.43 g per 100 g).
Zoom on proteins
- Its protein content (5.83 g per 100 g) is much higher than the average amount found in raw vegetables (1.87 g per 100 g).
Zoom on lipids
- The fat content of raw peas (0.55 g per 100 g) is almost identical to the average amount found in raw vegetables (0.56 g per 100 g).
- Raw peas are low in fat* as they contain no more than 3 g per 100 g.
*Regulation (EC) No 1924/2006 of the European Parliament and of the Council of 20 December 2006 on nutrition and health claims made on foods.
MINERALS AND TRACE ELEMENTS
| Constituent | Average content |
Min-Max per 100g |
DRV% |
|---|---|---|---|
| Calcium (mg) | 38 | - | 4,75 |
| Chloride (mg) | < 20 | - | - |
| Copper (mg) | 0,14 | - | 14 |
| Iron (mg) | 1,20 | - | 8,57 |
| Iodine (µg) | < 20 | - | - |
| Magnesium (mg) | 29 | - | 7,73 |
| Manganese (mg) | 0,29 | - | 14,50 |
| Phosphorus (mg) | 100 | - | 14,29 |
| Potassium (mg) | 190 | - | 9,50 |
| Selenium (µg) | < 20 | - | - |
| Sodium (mg) | 9 | - | - |
| Zinc (mg) | 0,72 | - | 7,20 |
| Constituent | Amount | Min-Max | DRV% |
|---|---|---|---|
| Calcium (mg) | Ciqual 2020 | - | Règlement (UE) N°1169/2011 du parlement Européen, et du conseil du 25 octobre 2011 |
| Chloride (mg) | Ciqual 2020 (valeur issue des analyses Ciqual-Aprifel 2018) | - | Règlement (UE) N°1169/2011 du parlement Européen, et du conseil du 25 octobre 2011 |
| Copper (mg) | Ciqual 2020 (valeur issue des analyses Ciqual-Aprifel 2018) | - | Règlement (UE) N°1169/2011 du parlement Européen, et du conseil du 25 octobre 2011 |
| Iron (mg) | Ciqual 2020 (valeur issue des analyses Ciqual-Aprifel 2018) | - | Règlement (UE) N°1169/2011 du parlement Européen, et du conseil du 25 octobre 2011 |
| Iodine (µg) | Ciqual 2020 (valeur issue des analyses Ciqual-Aprifel 2018) | - | Règlement (UE) N°1169/2011 du parlement Européen, et du conseil du 25 octobre 2011 |
| Magnesium (mg) | Ciqual 2020 (valeur issue des analyses Ciqual-Aprifel 2018) | - | Règlement (UE) N°1169/2011 du parlement Européen, et du conseil du 25 octobre 2011 |
| Manganese (mg) | Ciqual 2020 (valeur issue des analyses Ciqual-Aprifel 2018) | - | Règlement (UE) N°1169/2011 du parlement Européen, et du conseil du 25 octobre 2011 |
| Phosphorus (mg) | Ciqual 2020 (valeur issue des analyses Ciqual-Aprifel 2018) | - | Règlement (UE) N°1169/2011 du parlement Européen, et du conseil du 25 octobre 2011 |
| Potassium (mg) | Ciqual 2020 (valeur issue des analyses Ciqual-Aprifel 2018) | - | Règlement (UE) N°1169/2011 du parlement Européen, et du conseil du 25 octobre 2011 |
| Selenium (µg) | Ciqual 2020 (valeur issue des analyses Ciqual-Aprifel 2018) | - | Règlement (UE) N°1169/2011 du parlement Européen, et du conseil du 25 octobre 2011 |
| Sodium (mg) | Ciqual 2020 (valeur issue des analyses Ciqual-Aprifel 2018) | - | - |
| Zinc (mg) | Ciqual 2020 (valeur issue des analyses Ciqual-Aprifel 2018) | - | Règlement (UE) N°1169/2011 du parlement Européen, et du conseil du 25 octobre 2011 |
Zoom on minerals and trace elements
- Boiled peas contain significant amounts of manganese, phosphorus and copper. They provide the equivalent of:
- 14.50% of DRVs for manganese, i.e. 0.29 mg per 100 g;
- 14.29% of DRVs for phosphorus, i.e. 100 mg per 100 g;
- 14% of DRVs for copper, i.e. 0.14 mg per 100 g.
- The other minerals represent less than 10% of DRVs.
VITAMINS
| Constituent | Average content |
Min-Max per 100g |
DRV% |
|---|---|---|---|
| Provitamin A Beta-carotene (µg) | 316 | - | - |
| Vitamin A equivalent (µg) | 52,67 | - | 6,58 |
| Vitamin B1 (mg) | 0,14 | - | 12,73 |
| Vitamin B2 (mg) | < 0,01 | - | - |
| Vitamin B3 (mg) | 1,40 | - | 8,75 |
| Vitamin B5 (mg) | 0,24 | - | 4 |
| Vitamin B6 (mg) | 0,044 | - | 3,14 |
| Vitamin B9 (µg) | 38,20 | - | 19,10 |
| Vitamin C (mg) | 11,40 | - | 14,25 |
| Vitamin E (mg) | < 0,08 | - | - |
| Vitamin K1 (µg) | 9,90 | - | 13,20 |
| Constituent | Amount | Min-Max | DRV% |
|---|---|---|---|
| Provitamin A Beta-carotene (µg) | Ciqual 2020 (valeur issue des analyses Ciqual-Aprifel 2018) | - | - |
| Vitamin A equivalent (µg) | Calcul à partir de la valeur Provitamine A Béta-carotène* | - | Règlement (UE) N°1169/2011 du parlement Européen, et du conseil du 25 octobre 2011 |
| Vitamin B1 (mg) | Ciqual 2020 (valeur issue des analyses Ciqual-Aprifel 2018) | - | Règlement (UE) N°1169/2011 du parlement Européen, et du conseil du 25 octobre 2011 |
| Vitamin B2 (mg) | Ciqual 2020 (valeur issue des analyses Ciqual-Aprifel 2018) | - | Règlement (UE) N°1169/2011 du parlement Européen, et du conseil du 25 octobre 2011 |
| Vitamin B3 (mg) | Ciqual 2020 | - | Règlement (UE) N°1169/2011 du parlement Européen, et du conseil du 25 octobre 2011 |
| Vitamin B5 (mg) | Ciqual 2020 (valeur issue des analyses Ciqual-Aprifel 2018) | - | Règlement (UE) N°1169/2011 du parlement Européen, et du conseil du 25 octobre 2011 |
| Vitamin B6 (mg) | Ciqual 2020 (valeur issue des analyses Ciqual-Aprifel 2018) | - | Règlement (UE) N°1169/2011 du parlement Européen, et du conseil du 25 octobre 2011 |
| Vitamin B9 (µg) | Ciqual 2020 (valeur issue des analyses Ciqual-Aprifel 2018) | - | Règlement (UE) N°1169/2011 du parlement Européen, et du conseil du 25 octobre 2011 |
| Vitamin C (mg) | Ciqual 2020 (valeur issue des analyses Ciqual-Aprifel 2018) | - | Règlement (UE) N°1169/2011 du parlement Européen, et du conseil du 25 octobre 2011 |
| Vitamin E (mg) | Ciqual 2020 | - | Règlement (UE) N°1169/2011 du parlement Européen, et du conseil du 25 octobre 2011 |
| Vitamin K1 (µg) | Ciqual 2020 (valeur issue des analyses Ciqual-Aprifel 2018) | - | Règlement (UE) N°1169/2011 du parlement Européen, et du conseil du 25 octobre 2011 |
Zoom on vitamins
- Boiled peas are a source of vitamin B9 as they provide the equivalent of 19.10% of DRVs, i.e. 38.20 µg per 100 g.
- Boiled peas also contain significant amounts of vitamin C, vitamin K1 and vitamin B1. They provide the equivalent of:
- 14.25% of DRVs for vitamin C, i.e. 11.40 mg per 100 g;
- 13.20% of DRVs for vitamin K1, i.e. 9.90 mg per 100 g;
- 12.73% of DRVs for vitamin B1, i.e. 0.14 mg per 100 g.
- The other vitamins are present in smaller quantities, since they cover less than 9% of DRVs.
*Calculation made: Beta Carotene / 6 + retinol
POLYPHENOLS
Constituent
(mg)
Average content
Min-Max
per 100mg
Total polyphenols
0,48
0,35 - 0,71
Constituent
(mg)
Amount
Min-Max
Total polyphenols
Phénol-Explorer version 3.6 Méthode utilisée : Dosage du folin
-
Zoom on polyphenols
- Polyphenols are substances with an antioxidant effect.
- According to the folin method, cooked peas contain 0.48 mg of total polyphenols per 100 g.
Nutrition and health claims
According to the definitions of nutrition claims as set out in Regulation (EC) No 1924/2006 on nutrition and health claims, and in view of the composition of the raw pea, the following claims may be used:
NUTRITION CLAIMS OF RAW PEAS
- Low in fat (100 g of raw peas contain less than 3 g of fat)
- High in vitamin K1 (100 g of raw peas provide more than 30% of DRVs)
- High in vitamin C (100 g of raw peas provide more than 30% of DRVs)
- Source of fibre (100 g of raw peas provide more than 3 g of fibre)
- Source of vitamin B1 (100 g of raw peas provide more than 15% of DRVs)
- Source of vitamin B9 (100 g of raw peas provide more than 15% of DRVs)
- Source of manganese (100 g of raw peas provide more than 15% of DRVs)
- Source of phosphorus (100 g of raw peas provide more than 15% of DRVs)
HEALTH CLAIMS (for a consumption of 100 g of raw peas)
Vitamin K1
- Vitamin K1 contributes to:
- maintenance of normal bones,
- normal blood clotting.
Vitamin C
- Vitamin C contributes to:
- normal function of the immune system during and after intense physical exercise,
- normal collagen formation for the normal function of blood vessels,
- normal collagen formation for the normal function of bones,
- normal collagen formation for the normal function of cartilage,
- normal collagen formation for the normal function of gums,
- normal collagen formation for the normal function of skin,
- normal collagen formation for the normal function of teeth,
- normal energy-yielding metabolism,
- normal functioning of the nervous system,
- normal psychological function,
- normal function of the immune system,
- protection of cells from oxidative stress,
- reduction of tiredness and fatigue,
- regeneration of the reduced form of vitamin E.
- Vitamin C increases iron absorption.
Vitamin B1 or thiamine
- Thiamine contributes to:
- normal energy-yielding metabolism,
- normal functioning of the nervous system,
- normal psychological function,
- normal function of the heart.
Folates or vitamin B9
- Folates contribute to:
- maternal tissue growth during pregnancy,
- normal amino acid synthesis,
- normal blood formation,
- normal homocysteine metabolism,
- normal psychological function,
- normal function of the immune system,
- reduction of tiredness and fatigue.
- Folates have a role in the process of cell division.
Manganese
- Manganese contributes to:
- normal energy-yielding metabolism,
- maintenance of normal bones,
- normal formation of connective tissues,
- protection of cells from oxidative stress.
Phosphorus
- Phosphorus contributes to:
- normal energy-yielding metabolism,
- normal function of cell membranes,
- maintenance of normal bones,
- maintenance of normal teeth.
Nutrition and health claims
According to the definitions of nutrition claims as set out in Regulation (EC) No 1924/2006 on nutrition and health claims, and in view of the composition of the boiled pea, the following claims may be used:
NUTRITION CLAIMS OF BOILED PEAS
- Low in fat (100 g of boiled peas contain less than 3 g of fat)
- Low in sugar (100 g of boiled peas contain no more than 5 g of sugar)
- Source of fibre (100 g of boiled peas provide more than 3 g of fibre)
- Source of vitamin B9 (100 g of boiled peas provide more than 15% of DRVs)
HEALTH CLAIMS (for a consumption of 100 g of boiled peas)
Folates or vitamin B9
- Folates contribute to:
- maternal tissue growth during pregnancy,
- normal amino acid synthesis,
- normal blood formation,
- normal homocysteine metabolism,
- normal psychological function,
- normal function of the immune system,
- reduction of tiredness and fatigue.
- Folates have a role in the process of cell division.
References
- Agence nationale de sécurité sanitaire de l’alimentation, de l’environnement et du travail. Table de composition nutritionnelle des aliments Ciqual 2020. Consultée le 07/09/2020 depuis le site internet Ciqual https://ciqual.anses.fr/
- Agence nationale de sécurité sanitaire de l’alimentation, de l’environnement et du travail. Table de composition nutritionnelle des aliments Ciqual pour le calcul des apports nutritionnels CALNUT 2020. Consultée le 07/09/2020 depuis le site internet Ciqual https://ciqual.anses.fr/
- Bi S, Xu X, Luo D, Lao F, Pang X, Shen Q, Hu X, Wu J. Characterization of Key Aroma Compounds in Raw and Roasted Peas (Pisum sativum L.) by Application of Instrumental and Sensory Techniques. J Agric Food Chem. 2020;68(9):2718-27
- Devi J, Sanwal SK, Koley TK, Mishra GP, Karmakar P, Singh PM, Singh B. Variations in the total phenolics and antioxidant activities among garden pea (Pisum sativum L.) genotypes differing for maturity duration, seed and flower traits and their association with the yield. Scientia Horticulturae. 2019; 244:141–50.
- Edelenbos M, Christensen LP, Grevsen K. HPLC determination of chlorophyll and carotenoid pigments in processed green pea cultivars (Pisum sativum L.). J Agric Food Chem. 2001;49(10):4768-74.
- Fahim JR, Attia EZ, Kamel MS (2018). The phenolic profile of pea (Pisum sativum): a phytochemical and pharmacological overview. Phytochemistry Reviews. 2018; 18:173-98.
- McDonald LS, Salisbury PA, Ford R, Panozzo JF. Quantifying the colour loss of green field pea (Pisum sativum L.) due to bleaching. PLoS One. 2019;14(8):e0221523.
- Neveu V, Perez-Jiménez J, Vos F, Crespy V, du Chaffaut L, Mennen L, Knox C, Eisner R, Cruz J, Wishart D, Scalbert A. (2010) Phenol-Explorer: an online comprehensive database on polyphenol contents in foods. Database, doi: 10.1093/database/bap024. Full text (free access)
- Règlement (CE) N° 1924/2006 du Parlement européen et du Conseil du 20 décembre 2006 concernant les allégations nutritionnelles et de santé portant sur les denrées alimentaires.
- Règlement (UE) N°432/2012 de la Commission du 16 mai 2012 établissant une liste des allégations de santé autorisées portant sur les denrées alimentaires, autres que celles faisant référence à la réduction du risque de maladie ainsi qu’au développement et à la santé infantiles.
- Règlement (UE) n°1169/2011 du Parlement européen et du Conseil du 25 octobre 2011 concernant l’information des consommateurs sur les denrées alimentaires, modifiant les règlements (CE) n°1924/2006 et (CE) n°1925/2006 du Parlement européen et de Conseil et abrogeant la directive 87/250/CEE de la Commission, la directive 90/496/CEE du Conseil, la directive 1999/10/CE de la Commission, la directive 200/13/CE du Parlement européen et du Conseil, les directives 2002/67/CE et 2008/5/CE de la Commission et le règlement (CE) n°608/2004 de la Commission.
- Santos CS, Carbas B, Castanho A, Vasconcelos MW, Vaz Patto MC, Domoney C, Brites C. Variation in Pea (Pisum sativum L.) Seed Quality Traits Defined by Physicochemical Functional Properties. Foods. 2019; 13;8(11)
- Sell M, Steinhart H, Paschke A. Influence of maturation on the alteration of allergenicity of green pea (Pisum sativum L.). J Agric Food Chem. 2005;53(5):1717-22.
- Stanisavljević NS, Ilić MD, Matić IZ, Jovanović ŽS, Čupić T, Dabić DČ, Natić MM, Tešić ŽL. Identification of Phenolic Compounds from Seed Coats of Differently Colored European Varieties of Pea (Pisum sativumL.) and Characterization of Their Antioxidant and In Vitro Anticancer Activities. Nutrition and Cancer. 2016 ; 68(6):988–1000.
- Ubayasena L, Bett K, Tar’an B, Warkentin T. Genetic control and identification of QTLs associated with visual quality traits of field pea (Pisum sativum L.). Genome. 2011;54(4):261-72.
- Ubayasena L, Bett K, Tar’an B, Vijayan P, Warkentin T. Genetic control and QTL analysis of cotyledon bleaching resistance in green field pea (Pisum sativum L.). Genome. 2010;53(5):346-59.


