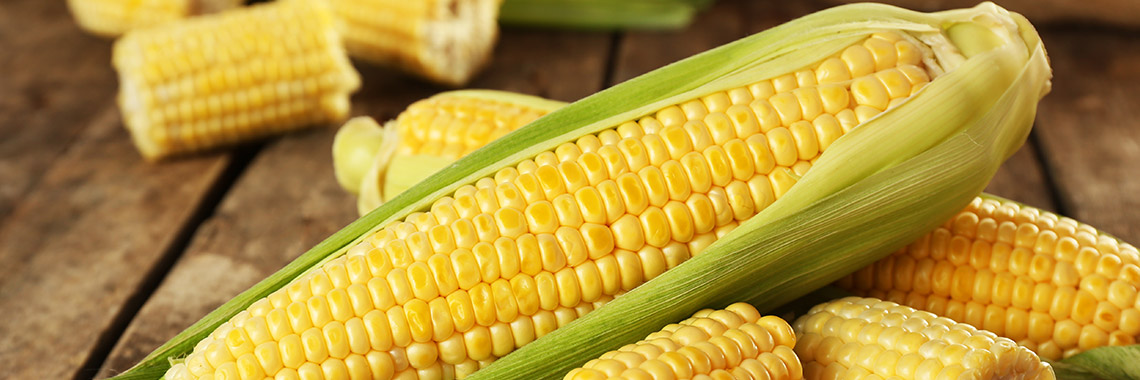
Yellow corn

Description
- Corn (Zea mays L.) belongs to the Poaceae family.
PHYSICAL AND ORGANOLEPTIC CHARACTERISTICS
- There are several varieties of corn with different colours. The best known and most widely consumed in France is yellow corn, but there are also purple (Ramos-Escudero, 2012), white, blue and red corn varieties (Lopez-Martinez, 2011).
- The purple colour is due to the presence of anthocyanin pigments (Lao, 2017) while carotenoid pigments give yellow corn its colour (Siyuan, 2018).
- The differentiation of corn varieties is not only based on colour, but on many criteria, including the shape, resistance and composition of the kernels. Thus, there are “popcorn” varieties, as well as “sweet” varieties for fresh or canned human consumption, and “corned” varieties used in the semolina industry (Chégut, 2018).
- According to consumers, post-harvest date and variety affects the taste and texture of boiled corn (Hongbete, 2017).
- Yellow corn has a relatively sweet taste (Hongbete, 2017).
- In addition, the colour of the husks (leaves that wrap around the cob) is thought to be an indicator of the freshness and taste of the corn. Thus, the fresher the corn husks (bright green colour), the more intense the sweetness of the corn, indicating that the corn is freshly harvested. On the other hand, corn husks that are less green in colour indicates less sweetness and a long post-harvest period (Hongbete, 2017).
COMPOSITION CHARACTERISTICS (excluding macronutrients, vitamins and minerals)
- All types of corn are rich in phenolic acids and flavonoids. Yellow corn is also rich in carotenoids (Siyuan, 2018).
- Yellow corn naturally contains carotenoids, some of which are precursors to vitamin A, and others xantophylls (Muzhingi, 2008).
- When boiled in water at 100°C for 30 min, its carotenoid concentration increases, while cooking at 230°C for 25 min decreases it by more than 70% compared to unprepared corn (Muzhingi, 2008).
- The phenolic content of 3 types of yellow corn varies from 132.2 to 262.5 mg gallic acid equivalent per 100 g dry weight (Gonzalez-Munoz, 2013). Among the compounds, vanillin, vanillic acid, protocatechuic acid, ferulic acid and p-coumaric acid have been identified (Gonzales-Munoz, 2013).
- The phenolic compound content of the fresh boiled yellow variety (6.1% DM) is significantly higher at the 5% threshold than the white variety (5.5% DM) (Hongbete, 2017).
- The low content of phenolic compounds gives corn varieties good protein digestibility, which is therefore a positive aspect for the nutritional quality of this cereal. Thus, corn of the white variety is reported to be more digestible than that of the yellow variety (Hongbete, 2017).
- Phenolic compounds are particularly present in the plants and have antioxidant activity. Therefore, their presence in fresh boiled corn kernels is thought to be beneficial to the health of consumers (Hongbete, 2017). Phenolic compounds in yellow corn (mainly carotenoids), through their antioxidant activity, reportedly help prevent and fight many pathologies, such as some cancers or macular degeneration (Rouf Shah, 2016).
- Most of the phytochemicals in corn with beneficial effects on human health are thought to be present in the bran and germ fractions and not in the endosperm, with about 87% of the total phenolic content (TPC) present in these fractions.
COOKED
The following values are approximate and depend on variety, season, ripeness, cultivation conditions, etc.
In the Ciqual table, energy values are calculated from the contents of fat, protein, carbohydrates, dietary fibre, polyols, organic acids and ethanol, each with a specific energy value. Since cooked corn on the cob is a food in which the presence of polyols and/or organic acids is suspected, and Ciqual does not have compositional data to quantify them, no energy value has been calculated (using the Ciqual 2020 table).
COMPOSITION TABLES
For each nutrient, the tables provide information on the content, minimum and maximum values, as well as the percentage of the Dietary Reference Values (DRVs) for 100 g net of cooked sweet corn on the cob (except for the table on polyphenols, which refers to raw whole corn kernels).
MACRONUTRIENTS
| Constituent (g) | Average content |
Min-Max per 100g |
DRV% |
|---|---|---|---|
| Water | 73,4 | 69,60 - 79,60 | - |
| Fibers | 2,40 | 2,30 - 2,80 | - |
| Carbohydrates | 18,60 | - | 7,15 |
| Sugars | 4,54 | - | 5,04 |
| Lipids | 1,50 | 1,28 - 2,04 | 2,14 |
| Saturated fat | 0,20 | - | 1 |
| Protein | 3,41 | 3,31 - 3,88 | 6,82 |
| Constituent (g) | Amount | Min-Max | DRV% |
|---|---|---|---|
| Water | Ciqual 2020 | - | - |
| Fibers | Ciqual 2020 | - | - |
| Carbohydrates | Ciqual 2020 | - | Règlement (UE) N°1169/2011 du parlement Européen et du conseil du 25 octobre 2011 |
| Sugars | Ciqual 2020 | - | Règlement (UE) N°1169/2011 du parlement Européen et du conseil du 25 octobre 2011 |
| Lipids | Ciqual 2020 | - | Règlement (UE) N°1169/2011 du parlement Européen et du conseil du 25 octobre 2011 |
| Saturated fat | Ciqual 2020 | - | Règlement (UE) N°1169/2011 du parlement Européen et du conseil du 25 octobre 2011 |
| Protein | Ciqual 2020 | - | Règlement (UE) N°1169/2011 du parlement Européen et du conseil du 25 octobre 2011 |
Zoom on carbohydrates
- The carbohydrate content of cooked corn on the cob (18.60 g per 100 g) is well above the average amount for cooked vegetables (4.85 g per 100 g).
Zoom on fibres
- Its fibre content (2.40 g per 100 g) is lower than the average amount in cooked vegetables (2.89 g per 100 g).
Zoom on proteins
- Its protein content (3.41 g per 100 g) is higher than the average amount found in cooked vegetables (2 g per 100 g).
Zoom on lipids
- Its fat content (1.5 g per 100 g) is higher than the average amount found in cooked vegetables (0.53 g per 100 g). With less than 3 g per 100 g, corn on the cob is low in fat*.
*Regulation (EC) No 1924/2006 of the European Parliament and of the Council of 20 December 2006 on nutrition and health claims made on foods.
MINERALS AND TRACE ELEMENTS
| Constituent | Average content |
Min-Max per 100g |
DRV% |
|---|---|---|---|
| Calcium (mg) | 3 | 1 - 6 | 0,38 |
| Chloride (mg) | - | - | - |
| Copper (mg) | 0,049 | 0 - 0,086 | 4,90 |
| Iron (mg) | 0,45 | 0,29 - 0,62 | 3,21 |
| Iodine (µg) | 1 | - | 0,67 |
| Magnesium (mg) | 26 | 9 - 41 | 6,93 |
| Manganese (mg) | 0,17 | 0,078 - 0,27 | 8,50 |
| Phosphorus (mg) | 77 | 45 - 102 | 11 |
| Potassium (mg) | 218 | 125 - 302 | 10,90 |
| Selenium (µg) | - | - | - |
| Sodium (mg) | 1 | 0 - 9 | - |
| Zinc (mg) | 0,62 | 0,28 - 1 | 6,20 |
| Constituent | Amount | Min-Max | DRV% |
|---|---|---|---|
| Calcium (mg) | Ciqual 2020 | - | Règlement (UE) N°1169/2011 du parlement Européen et du conseil du 25 octobre 2011 |
| Chloride (mg) | Ciqual 2020 | - | Règlement (UE) N°1169/2011 du parlement Européen, et du conseil du 25 octobre 2011 |
| Copper (mg) | Ciqual 2020 | - | Règlement (UE) N°1169/2011 du parlement Européen et du conseil du 25 octobre 2011 |
| Iron (mg) | Ciqual 2020 | - | Règlement (UE) N°1169/2011 du parlement Européen et du conseil du 25 octobre 2011 |
| Iodine (µg) | Ciqual 2020 | - | Règlement (UE) N°1169/2011 du parlement Européen et du conseil du 25 octobre 2011 |
| Magnesium (mg) | Ciqual 2020 | - | Règlement (UE) N°1169/2011 du parlement Européen et du conseil du 25 octobre 2011 |
| Manganese (mg) | Ciqual 2020 | - | Règlement (UE) N°1169/2011 du parlement Européen et du conseil du 25 octobre 2011 |
| Phosphorus (mg) | Ciqual 2020 | - | Règlement (UE) N°1169/2011 du parlement Européen et du conseil du 25 octobre 2011 |
| Potassium (mg) | Ciqual 2020 | - | Règlement (UE) N°1169/2011 du parlement Européen et du conseil du 25 octobre 2011 |
| Selenium (µg) | Ciqual 2020 | - | Règlement (UE) N°1169/2011 du parlement Européen et du conseil du 25 octobre 2011 |
| Sodium (mg) | Ciqual 2020 | - | - |
| Zinc (mg) | Ciqual 2020 | - | Règlement (UE) N°1169/2011 du parlement Européen et du conseil du 25 octobre 2011 |
Zoom on minerals and trace elements
- Cooked corn on the cob contains significant amounts of phosphorus and potassium. In fact, it provides the equivalent of:
- 11% of DRVs for phosphorus, i.e. 77 mg per 100 g;
- 10.90% of DRVs for potassium, i.e. 218 mg per 100 g.
- The other minerals and trace elements are present in corn on the cob in amounts representing less than 9% of DRVs.
VITAMINS
| Constituent | Average content |
Min-Max per 100g |
DRV% |
|---|---|---|---|
| Provitamin A Beta-carotene (µg) | 66 | - | - |
| Vitamin A equivalent (µg) | 11 | - | 1,38 |
| Vitamin B1 (mg) | 0,093 | 0,08 - 0,11 | 8,45 |
| Vitamin B2 (mg) | 0,057 | 0,05 - 0,06 | 4,07 |
| Vitamin B3 (mg) | 1,68 | 1,61 - 1,93 | 10,50 |
| Vitamin B5 (mg) | 0,79 | 0,59 - 0,88 | 13,17 |
| Vitamin B6 (mg) | 0,14 | 0,06 - 0,34 | 10 |
| Vitamin B9 (µg) | 23 | - | 11,50 |
| Vitamin C (mg) | 5,50 | 3 - 6,20 | 6,88 |
| Vitamin E (mg) | 0,09 | NC - 0,88 | 0,75 |
| Vitamin K1 (µg) | 0,40 | - | 0,53 |
| Constituent | Amount | Min-Max | DRV% |
|---|---|---|---|
| Provitamin A Beta-carotene (µg) | Ciqual 2020 | - | - |
| Vitamin A equivalent (µg) | Calcul à partir de la valeur Provitamine A Béta-carotène* | - | Règlement (UE) N°1169/2011 du parlement Européen et du conseil du 25 octobre 2011 |
| Vitamin B1 (mg) | Ciqual 2020 | - | Règlement (UE) N°1169/2011 du parlement Européen et du conseil du 25 octobre 2011 |
| Vitamin B2 (mg) | Ciqual 2020 | - | Règlement (UE) N°1169/2011 du parlement Européen et du conseil du 25 octobre 2011 |
| Vitamin B3 (mg) | Ciqual 2020 | - | Règlement (UE) N°1169/2011 du parlement Européen et du conseil du 25 octobre 2011 |
| Vitamin B5 (mg) | Ciqual 2020 | - | Règlement (UE) N°1169/2011 du parlement Européen et du conseil du 25 octobre 2011 |
| Vitamin B6 (mg) | Ciqual 2020 | - | Règlement (UE) N°1169/2011 du parlement Européen et du conseil du 25 octobre 2011 |
| Vitamin B9 (µg) | Ciqual 2020 | - | Règlement (UE) N°1169/2011 du parlement Européen et du conseil du 25 octobre 2011 |
| Vitamin C (mg) | Ciqual 2020 | - | Règlement (UE) N°1169/2011 du parlement Européen et du conseil du 25 octobre 2011 |
| Vitamin E (mg) | Ciqual 2020 | - | Règlement (UE) N°1169/2011 du parlement Européen et du conseil du 25 octobre 2011 |
| Vitamin K1 (µg) | Ciqual 2020 | - | Règlement (UE) N°1169/2011 du parlement Européen et du conseil du 25 octobre 2011 |
Zoom on vitamins
- Cooked corn on the cob contains significant amounts of vitamin B5, vitamin B9, vitamin B3 and vitamin B6. In fact, it provides the equivalent of:
- The other vitamins are present in quantities representing less than 9% of DRVs.
*Calculation made: Beta-Carotene / 6 + retinol
POLYPHENOLS
| Constituent (mg) | Average content |
Min-Max per 100mg |
|---|---|---|
| Flavonoids (mg) | < 0,01 | 0,01 - 0,01 |
| of which Anthocyanins (mg) | < 0,01 | 0,01 - 0,01 |
| Phenolic Acids (mg) | 214,56 | 110,96 - 329,98 |
| of which Hydroxybenzoic acids (mg) | 2,41 | 1,06 - 4,27 |
| of which Hydroxycinnamic acids (mg) | 212,15 | 109,90 - 325,71 |
| Lignanes (mg) | 0,33 | 0,07 - 0,77 |
| Total polyphenols | 214,9 | 111,04 - 330,76 |
| Constituent (mg) | Amount | Min-Max |
|---|---|---|
| Flavonoids | Phenol Explorer 3.6 Méthode utilisée : Chromatographie | - |
| of which Anthocyanins | Phenol Explorer 3.6 Méthode utilisée : Chromatographie | - |
| Phenolic Acids | Phenol Explorer 3.6 Méthode utilisée : Chromatographie | - |
| of which Hydroxybenzoic acids | Phenol Explorer 3.6 Méthode utilisée : Chromatographie | - |
| of which Hydroxycinnamic acids | Phenol Explorer 3.6 Méthode utilisée : Chromatographie | - |
| Lignanes | Phenol Explorer 3.6 Méthode utilisée : Chromatographie | - |
| Total polyphenols | Phenol Explorer 3.6 Méthode utilisée : Chromatographie | - |
Zoom on polyphenols (For raw whole corn kernels)
- Polyphenols are substances with an antioxidant effect.
- Corn polyphenols are 99% hydroxycinamic acids, and in particular ferulic acid (79% of total polyphenols).
Nutrition and health claims
According to the definitions of nutrition claims as set out in Regulation (EC) No 1924/2006 on nutrition and health claims, and in view of the composition of corn, the following claims may be used
Nutrition claims of corn
- Low in fat (100 g of corn provide less than 3 g of fat)
References
- Agence nationale de sécurité sanitaire de l’alimentation, de l’environnement et du travail. Table de composition nutritionnelle des aliments Ciqual 2020. Consultée le 26/08/2020 depuis le site internet Ciqual https://ciqual.anses.fr/
- Chégut M, Hardy C, Lebarbier R, Marot MF, Martin E, Nicolaï L / Agreste Nouvelle-Aquitaine. Filière maïs grain [en ligne]. [Consulté le 03/05/2020]. Disponible à l’adresse : http://www.epsilon.insee.fr/jspui/bitstream/1/84615/3/agr_NA_filiere_ma%C3%AFs_2018_09.pdf
- González-Muñoz A, Quesille-Villalobos AM, Fuentealba C, Shetty K, Gálvez Ranilla L. Potential of Chilean native corn (Zea mays L.) accessions as natural sources of phenolic antioxidants and in vitro bioactivity for hyperglycemia and hypertension management. J Agric Food Chem. 2013;61(46):10995-1007.
- Hongbete F, Kindossi JM, Hounhouigan JD, Nago MC. Production et qualité nutritionnelle des épis de maïs frais bouillis consommés au Bénin. International Journal of Biological and Chemical Sciences. 2017;11(5):2378-92.
- Lao F, Sigurdson GT, Giusti MM. Health benefits of purple corn (Zea mays L.) phenolic compounds. Comprehensive Reviews in Food Science and Food Safety. 2017;16(2):234-46.
- Lopez-Martinez LX, Parkin KL, Garcia HS. Phase II-inducing, polyphenols content and antioxidant capacity of corn (Zea mays L.) from phenotypes of white, blue, red and purple colors processed into masa and tortillas. Plant Foods Hum Nutr. 2011;66(1):41-7.
- Muzhingi T, Yeum KJ, Russell RM, Johnson EJ, Qin J, Tang G. Determination of carotenoids in yellow maize, the effects of saponification and food preparations. Int J Vitam Nutr Res. 2008;78(3):112-20.
- Neveu V, Perez-Jiménez J, Vos F, Crespy V, du Chaffaut L, Mennen L, Knox C, Eisner R, Cruz J, Wishart D, Scalbert A. (2010) Phenol-Explorer: an online comprehensive database on polyphenol contents in foods. Database, doi: 10.1093/database/bap024. Full text (free access)
- Ramos-Escudero F, Muñoz AM, Alvarado-Ortíz C, Alvarado Á, Yáñez JA. Purple corn (Zea mays L.) phenolic compounds profile and its assessment as an agent against oxidative stress in isolated mouse organs. J Med Food. 2012;15(2):206-15.
- Règlement (CE) N° 1924/2006 du Parlement européen et du Conseil du 20 décembre 2006 concernant les allégations nutritionnelles et de santé portant sur les denrées alimentaires.
- Règlement (UE) N°432/2012 de la Commission du 16 mai 2012 établissant une liste des allégations de santé autorisées portant sur les denrées alimentaires, autres que celles faisant référence à la réduction du risque de maladie ainsi qu’au développement et à la santé infantiles.
- Règlement (UE) n°1169/2011 du Parlement européen et du Conseil du 25 octobre 2011 concernant l’information des consommateurs sur les denrées alimentaires, modifiant les règlements (CE) n°1924/2006 et (CE) n°1925/2006 du Parlement européen et de Conseil et abrogeant la directive 87/250/CEE de la Commission, la directive 90/496/CEE du Conseil, la directive 1999/10/CE de la Commission, la directive 200/13/CE du Parlement européen et du Conseil, les directives 2002/67/CE et 2008/5/CE de la Commission et le règlement (CE) n°608/2004 de la Commission.
- Rouf Shah T, Prasad K, Kumar P. Maize—A potential source of human nutrition and health: A review. Cogent Food & Agriculture. 2016; 2(1):1166995
- Siyuan S, Tong L, Liu R. Corn phytochemicals and their health benefits. Food Science and Human Wellness. 2018;7(3):185-95.


